
Population
Following a slight decline between 2000 and 2014, the County’s population is projected to increase to 55,630 by 2020. A notable population trend between 2000 and 2014 is a near 20% increase in residents in their peak earning years (age 45-‐64.) Although longer‐term projections show modest decline, the County’s committed efforts to attract new businesses and residents are designed to turn that trend around.
Summary (2014-2015 Data)
| Population & Households | Fulton County |
| Population (2010) | 55,153 |
| Population 2020 (projected) | 55,629 |
| Households | 22.300 |
| Average Household Sites | 2.4 |
| % Population over 65 (2010) | 16% |
| % Population over 65 (2020) | 19.4% |
| Households by Income (2015 est) | |
| Median Household Income | $47,000 |
| < $25,000 | 5,860 |
| $25,000 - $50,000 | 5,940 |
| $50,000 - $75,000 | 4,590 |
| $75,000 - $100,000 | 2,370 |
| $100,000 - $150,000 | 2,670 |
| $150,000 | 856 |
| Housing | |
| Housing Units (2010) | 28,600 |
| Pct. Owner Occupied (2011-2015) | 70% |
| Pct. Renter Occupied | 30% |
| Median Home Value | $108,200 |
| Median Gross Rent | $711 |
| % of Housing Stock Built Before 1939 | 37.7% |
| Total Number of Seasonal Homes | 3,450 |
| Education | |
| High School Graduate or Higher | 86% |
| Pct. Bachelor Degree or Higher | 16.2% |
| Economy | |
| Mean Travel Time to Work (minutes) | 24.1 |
| Retail Sales per Capita (2012) | $12,300 |
| Unemployment Rate | 5.7% |
| Average Wage for a Fulton County Employee (2014) | $17.00/hour |
| Average Wage in Manufacturing | $19.30/hour |
| Average Wage in Wholesale | $22.20/hour |
| Average Wage in Transportation and Warehosing | $18.00/hour |
Housing
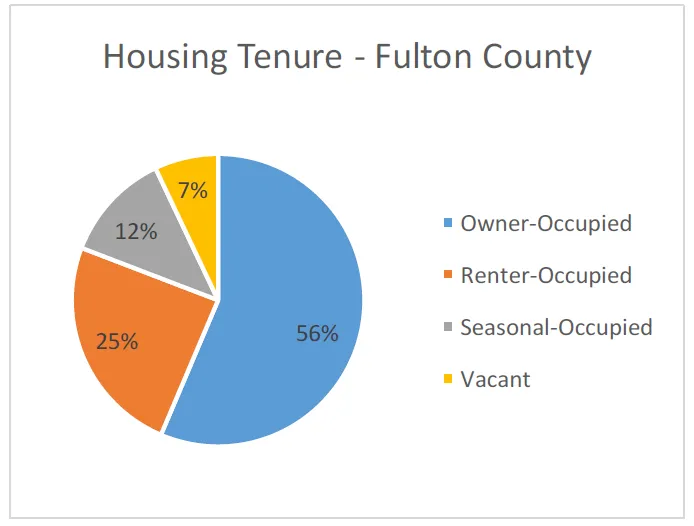
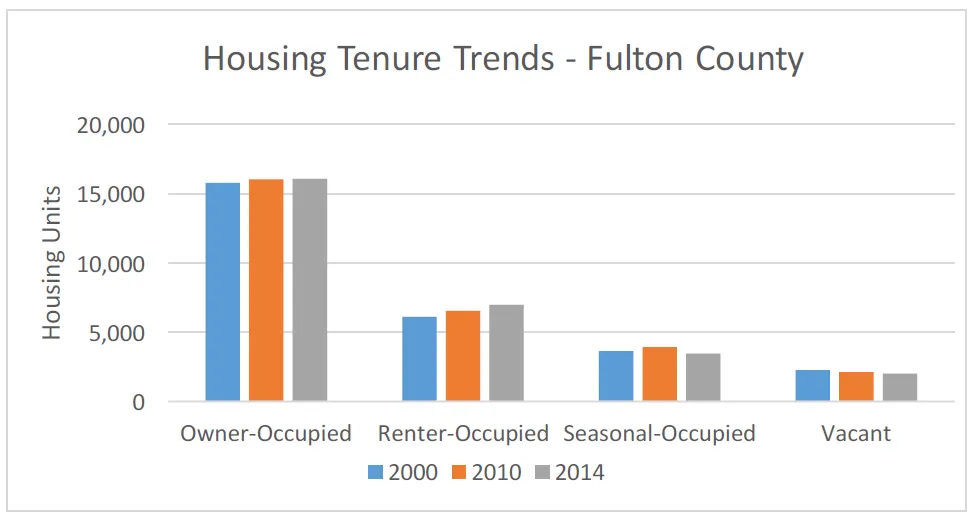
Fulton County’s existing housing stock features a strong supply of beautiful historic homes, as well as affordable properties that may need reinvestment (85% of units were constructed before 1990). Between 2005 and 2015, over $136 million was invested in the County’s housing stock to build 158 multi-‐family units including market rate conversions in the cities and 826 single-‐family homes. According to building permit data, the average cost of constructing a multi-‐family unit was nearly $60,000 and $154,000 for a single-‐family home. The housing mix is changing, with a growing percentage of rental units. Existing senior housing units in the County have sustained vacancy rates below 3% and maintain waiting lists.


| Housing Unit Status | 2000 | 2010 | 2014 | % Change 2000-2014 | % Change 2010-2014 |
|---|---|---|---|---|---|
| Owner Occupied | 15,776 | 16,001 | 16,050 | 1.7% | 0.3% |
| Renter Occupied | 6,108 | 6,553 | 6,956 | 13.9% | 6.1% |
| Seasonal Occupied | 3,631 | 3,907 | 3,451 | -5.0% | -11.7% |
| Vacant | 2,272 | 2,101 | 2,007 | -11.7% | -4.5% |
| Total | 27,787 | 28,562 | 28,464 | 2.4% | -0.3% |
Housing Values
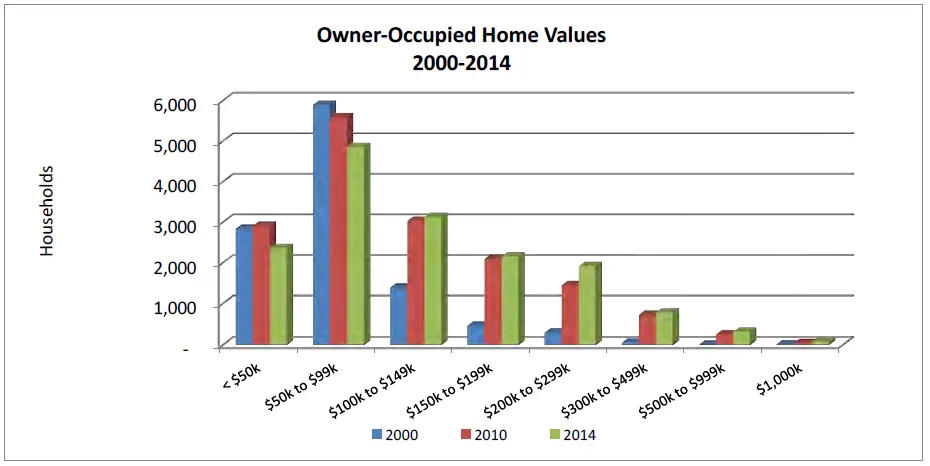
The average median value of an owner-‐occupied home in 2014 was $107,500, slightly below the New York State median home value of $112,000.3 2014 Home values rose 59.5% since 2000 and 12.9% since 2010. The Town of Mayfield has the highest home value ($264,000) with the most affordable value in the City of Gloversville ($76,000.) Apartment rents in the County are also reasonable with a 2014 average median rate of $700 per month.4
Homes in Fulton County are reasonably priced and offer generally more affordable options than other surrounding counties, especially neighboring Saratoga County.

Income
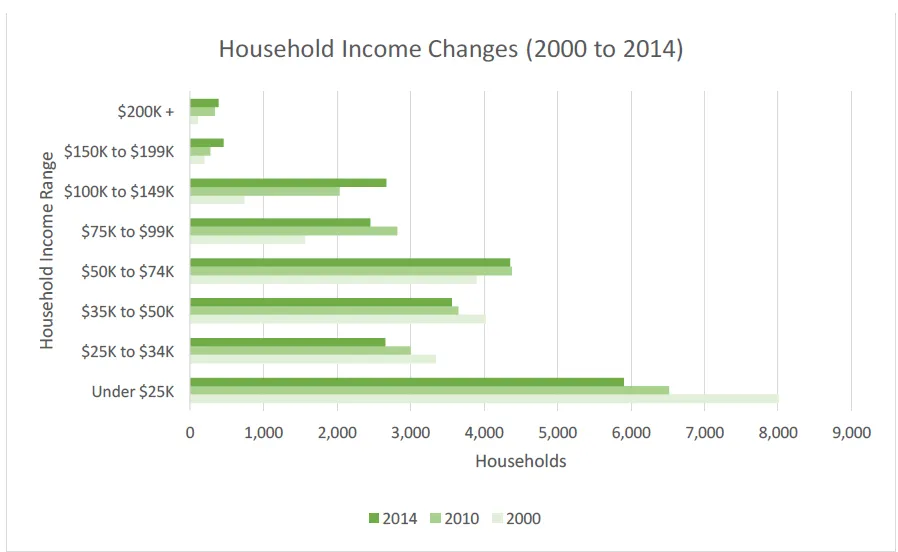
Household incomes have been rising resulting in additional spending power. Between 2010 and 2014, the average median household income grew by nearly ten percent to $55,550.
Homes in Fulton County are reasonably priced and offer generally more affordable options than other surrounding counties, especially neighboring Saratoga County.


